

Extra material: Multi-product facility production#
Preamble: Install Pyomo and a solver#
The following cell sets and verifies a global SOLVER for the notebook. If run on Google Colab, the cell installs Pyomo and the HiGHS solver, while, if run elsewhere, it assumes Pyomo and HiGHS have been previously installed. It then sets to use HiGHS as solver via the appsi module and a test is performed to verify that it is available. The solver interface is stored in a global object SOLVER for later use.
import sys

if 'google.colab' in sys.modules:
    %pip install pyomo >/dev/null 2>/dev/null
    %pip install highspy >/dev/null 2>/dev/null

solver = 'appsi_highs'

import pyomo.environ as pyo
SOLVER = pyo.SolverFactory(solver)

assert SOLVER.available(), f"Solver {solver} is not available."
Maximizing the profit in the worst case for a multi-product facility#
A common formulation for the problem of maximizing profit of a multi-product facility in a resource constrained environment is given by the following linear optimization problem:
where \(x_j\) is the production of product \(j\in J\), \(c_j\) is the net profit from producing and selling one unit of product \(j\), \(a_{i, j}\) is the amount of resource \(i\) required to produce a unit of product \(j\), and \(b_i\) is the amount of resource \(i\in I\) available. If these data are available, an LO solution can provide information about an optimal production plan and the marginal value of additional resources.
But what if coefficients of the model are uncertain? What should be the objective then? Does uncertainty change the production plan? Does the uncertainty change the marginal value assigned to resources? These are complex and thorny questions that will be largely reserved for later chapters of this book. However, it is possible to consider a specific situation within the current context.
Consider a situation where there are multiple plausible models for the net profit. These might be a result of marketing studies or from considering plant operation under multiple scenarios, which we collect in a set \(S\). The set of profit models could be written
where \(s\) indexes the set of possible scenarios. The worst-case criterion requires no probabilities: every scenario constrains the guaranteed profit.
One conservative criterion is to maximize profit in the worst case. Letting \(z\) denote the profit for the worst case, this criterion requires finding a production plan \((x_j)_{j\in J}\) that satisfies
where \(z\) is a lower bound on profit in every scenario. Maximizing it gives the largest guaranteed profit.
Data#
The profit scenarios are the same as in the BIM worst-case example. The resource table below defines this data-driven extension. Here copper availability is 4000, with copper requirements of 1 and 2 per unit of products 1 and 2, respectively. The plastic and germanium limits imply \(x_1+2x_2=(x_1+x_2)+x_2\leq1750+1500=3250\), so the copper capacity of 4000 cannot bind in this instance.
import pandas as pd

BIM_scenarios = pd.DataFrame(
    [[12, 9], [11, 10], [8, 11]], columns=["product 1", "product 2"]
)

BIM_scenarios.index.name = "scenarios"
print("\nProfit scenarios")
display(BIM_scenarios)

BIM_resources = pd.DataFrame(
    [
        ["silicon", 1000, 1, 0],
        ["germanium", 1500, 0, 1],
        ["plastic", 1750, 1, 1],
        ["copper", 4000, 1, 2],
    ],
    columns=["resource", "available", "product 1", "product 2"],
)
BIM_resources = BIM_resources.set_index("resource")

print("\nAvailable resources and resource requirements")
display(BIM_resources)
Profit scenarios
| product 1 | product 2 | |
|---|---|---|
| scenarios | ||
| 0 | 12 | 9 |
| 1 | 11 | 10 |
| 2 | 8 | 11 |
Available resources and resource requirements
| available | product 1 | product 2 | |
|---|---|---|---|
| resource | |||
| silicon | 1000 | 1 | 0 |
| germanium | 1500 | 0 | 1 |
| plastic | 1750 | 1 | 1 |
| copper | 4000 | 1 | 2 |
Pyomo model#
An implementation of the maximum worst-case profit model.
def maxmin(scenarios, resources):
    model = pyo.ConcreteModel("BIM production planning for worst-case profit")

    products = resources.columns.tolist()
    products.remove("available")

    model.I = pyo.Set(initialize=resources.index)
    model.J = pyo.Set(initialize=products)
    model.S = pyo.Set(initialize=scenarios.index)

    @model.Param(model.I, model.J)
    def a(m, i, j):
        return resources.loc[i, j]

    @model.Param(model.I)
    def b(m, i):
        return resources.loc[i, "available"]

    @model.Param(model.S, model.J)
    def c(m, s, j):
        return scenarios.loc[s, j]

    model.x = pyo.Var(model.J, domain=pyo.NonNegativeReals)
    model.z = pyo.Var()

    @model.Objective(sense=pyo.maximize)
    def profit(m):
        return m.z

    @model.Constraint(model.S)
    def scenario_profit(m, s):
        return m.z <= sum(m.c[s, j] * m.x[j] for j in m.J)

    @model.Constraint(model.I)
    def resource_limits(m, i):
        return sum(m.a[i, j] * m.x[j] for j in m.J) <= m.b[i]

    return model


m = maxmin(BIM_scenarios, BIM_resources)
results = SOLVER.solve(m)
pyo.assert_optimal_termination(results)

worst_case_profit = m.profit()
print("\nWorst case profit =", worst_case_profit)

worst_case_plan = pd.Series({j: m.x[j]() for j in m.J}, name="worst case")
print(f"\nWorst case production plan:")
display(worst_case_plan)
Worst case profit = 17500.0

Worst case production plan:
product 1     583.333333
product 2    1166.666667
Name: worst case, dtype: float64
Optimizing for the mean scenario#
Is maximizing the worst case a good idea? Maximizing the worst case among all cases is a conservative planning outlook. It may be worth investigating alternative planning outlooks.
Here the mean scenario is the arithmetic average of the three profit vectors, giving each scenario equal weight. This is an average-scenario comparison; it is an expected-profit comparison only if the scenarios are assigned equal probabilities.
The first step is to create a model to optimize a single scenario. Without repeating the mathematical description, the following Pyomo model is simply the maxmin model adapted to a single scenario.
def max_profit(scenario, resources):
    model = pyo.ConcreteModel("BIM")

    products = resources.columns.tolist()
    products.remove("available")

    model.I = pyo.Set(initialize=resources.index)
    model.J = pyo.Set(initialize=products)

    @model.Param(model.I, model.J)
    def a(m, i, j):
        return resources.loc[i, j]

    @model.Param(model.I)
    def b(m, i):
        return resources.loc[i, "available"]

    @model.Param(model.J)
    def c(m, j):
        return scenario[j]

    model.x = pyo.Var(model.J, domain=pyo.NonNegativeReals)
    model.z = pyo.Var()

    @model.Objective(sense=pyo.maximize)
    def profit(m, s):
        return sum(m.c[j] * m.x[j] for j in m.J)

    @model.Constraint(model.I)
    def resource_limits(m, i):
        return sum(m.a[i, j] * m.x[j] for j in m.J) <= m.b[i]

    return model
The next cell computes the optimal plan for the mean scenario.
# create mean scenario
mean_case = max_profit(BIM_scenarios.mean(), BIM_resources)
results = SOLVER.solve(mean_case)
pyo.assert_optimal_termination(results)

mean_case_profit = mean_case.profit()
mean_case_plan = pd.Series({j: mean_case.x[j]() for j in mean_case.J}, name="mean case")

print(f"\nMean case profit = {mean_case_profit:0.1f}")
print("\nMean case production plan:")
print(mean_case_plan)
Mean case profit = 17833.3

Mean case production plan:
product 1    1000.0
product 2     750.0
Name: mean case, dtype: float64
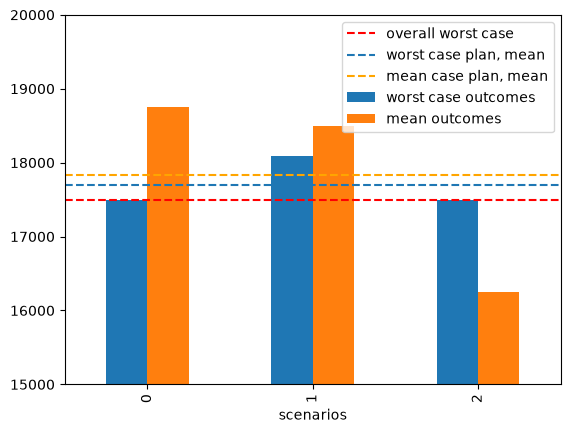
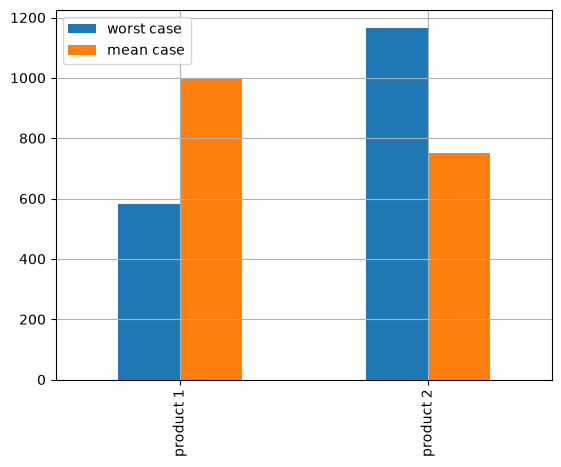
The mean-scenario plan produces 1000 units of product 1 and 750 of product 2. Its average scenario profit is 17833.3, and its worst-case profit is 16250. The worst-case plan produces approximately 583.3 and 1166.7 units, respectively; it guarantees 17500 and has an average scenario profit of 17694.4.
Thus, choosing the mean-scenario plan increases the average profit by about 138.9, while reducing the guaranteed profit by 1250. Which plan should be preferred?
mean_case_outcomes = BIM_scenarios.dot(mean_case_plan)
mean_case_outcomes.name = "mean outcomes"

worst_case_outcomes = BIM_scenarios.dot(worst_case_plan)
worst_case_outcomes.name = "worst case outcomes"

ax = pd.concat([worst_case_outcomes, mean_case_outcomes], axis=1).plot(
    kind="bar", ylim=(15000, 20000)
)
ax.axhline(worst_case_profit, linestyle="--", color="red", label="overall worst case")
ax.axhline(worst_case_outcomes.mean(), linestyle="--", label="worst case plan, mean")
ax.axhline(
    mean_case_outcomes.mean(),
    linestyle="--",
    color="orange",
    label="mean case plan, mean",
)
ax.legend()
ax = pd.concat([worst_case_plan, mean_case_plan], axis=1).plot(kind="bar", grid=True)
Summary#
In this example, the worst-case plan increases the guaranteed profit from 16250 to 17500. The mean-scenario plan has a higher average and best-case profit. The choice depends on whether the planner prioritizes the guarantee or the average-scenario comparison.
Which plan would you choose? Why?
Make a case for the other choice.